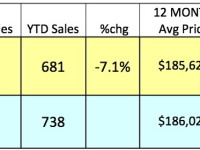
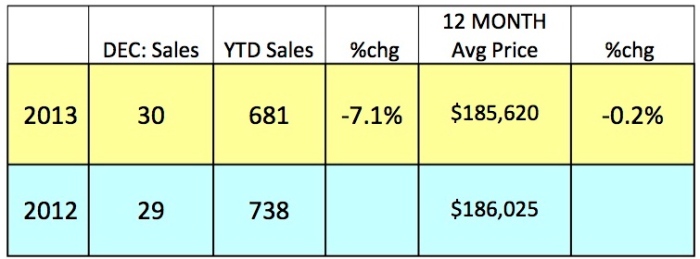
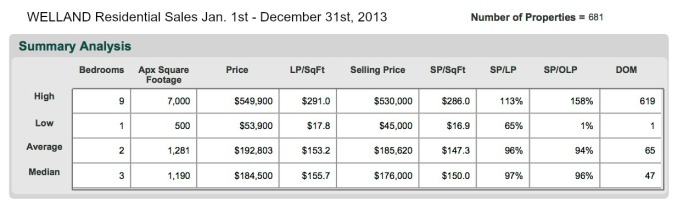
Preliminary year-end results for the City of Welland indicate that sales activity dropped 7.1% in 2013. The Rose City’s 12-month average price of $185,620 slipped marginally from last year's year-end tally of $186,025.
In total, there were 681 residential sales reported in Welland during the year compared to 738 transactions recorded in 2012. The average days on the market for the homes that sold shifted to 65 days an improvement over last year's average of 72 days.
Although the overall sales volume across is lagging behind last year, listing inventory levels continue to trend down. The net effect of reduced supply is keeping the local market in a tenative state of balance.

The numbers used to make the tables came from the Niagara Association of REALTORS® as at January 8th, 2014. The data is deemed reliable but not guaranteed.
For more local number please check out the Local Market Updates section of our Niagara Realty Source BLOG. We also distribute a summary report monthly via our Team Berkhout Bosse Newsletter.
SIGN UP HERE to join our Newsletter Mailing List.
